Beyond 60/40

Institutional Investment Insights for Thoughtful Investors

Beyond 60/40

The Best Investment Strategy for Retirees for the Next Decade

The Best Investment Strategy for Retirees for the Next Decade

The 4% withdrawal rule is a bedrock principle of financial planning for a reason. The central idea is that when you have accumulated enough in assets to draw 4% a year, increased by 3% each year to cover inflation, you can retire. In other words, when you have 25x your annual expenses saved. Personal Finance author Nick Maggiulli found a 100% probability, historically (1926 to 2022), that a 4% withdrawal rate was sustainable in retirement.

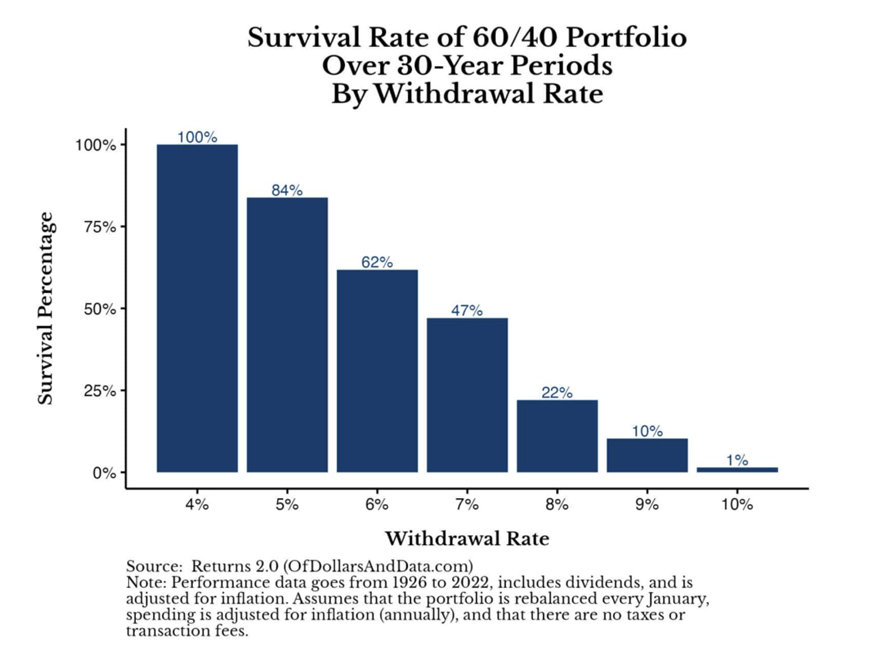
Financial Planning writer and podcaster Michael Kitces further extended the study to show that investors following this rule were historically more likely to quadruple their money than run out. Given that only 18% of retirees actually increase their spending in retirement, this rule of thumb should give retirees who meet the threshold a lot of confidence.


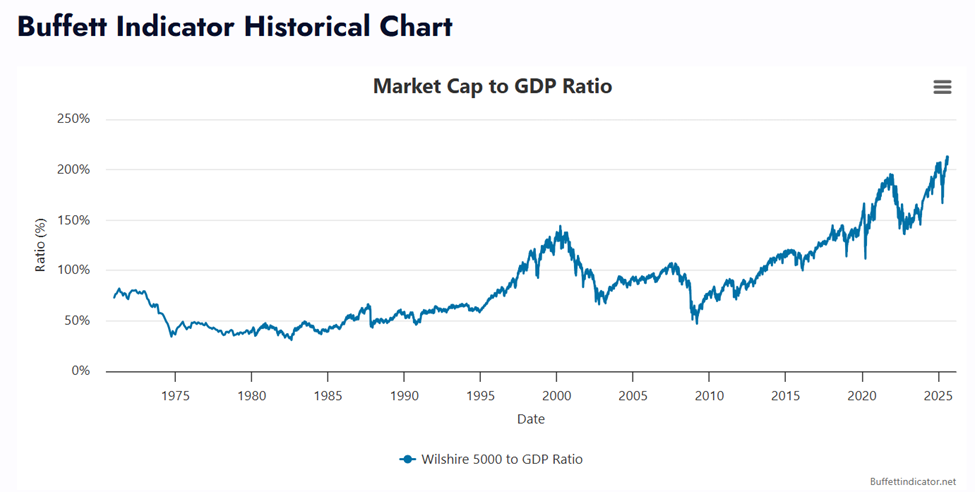
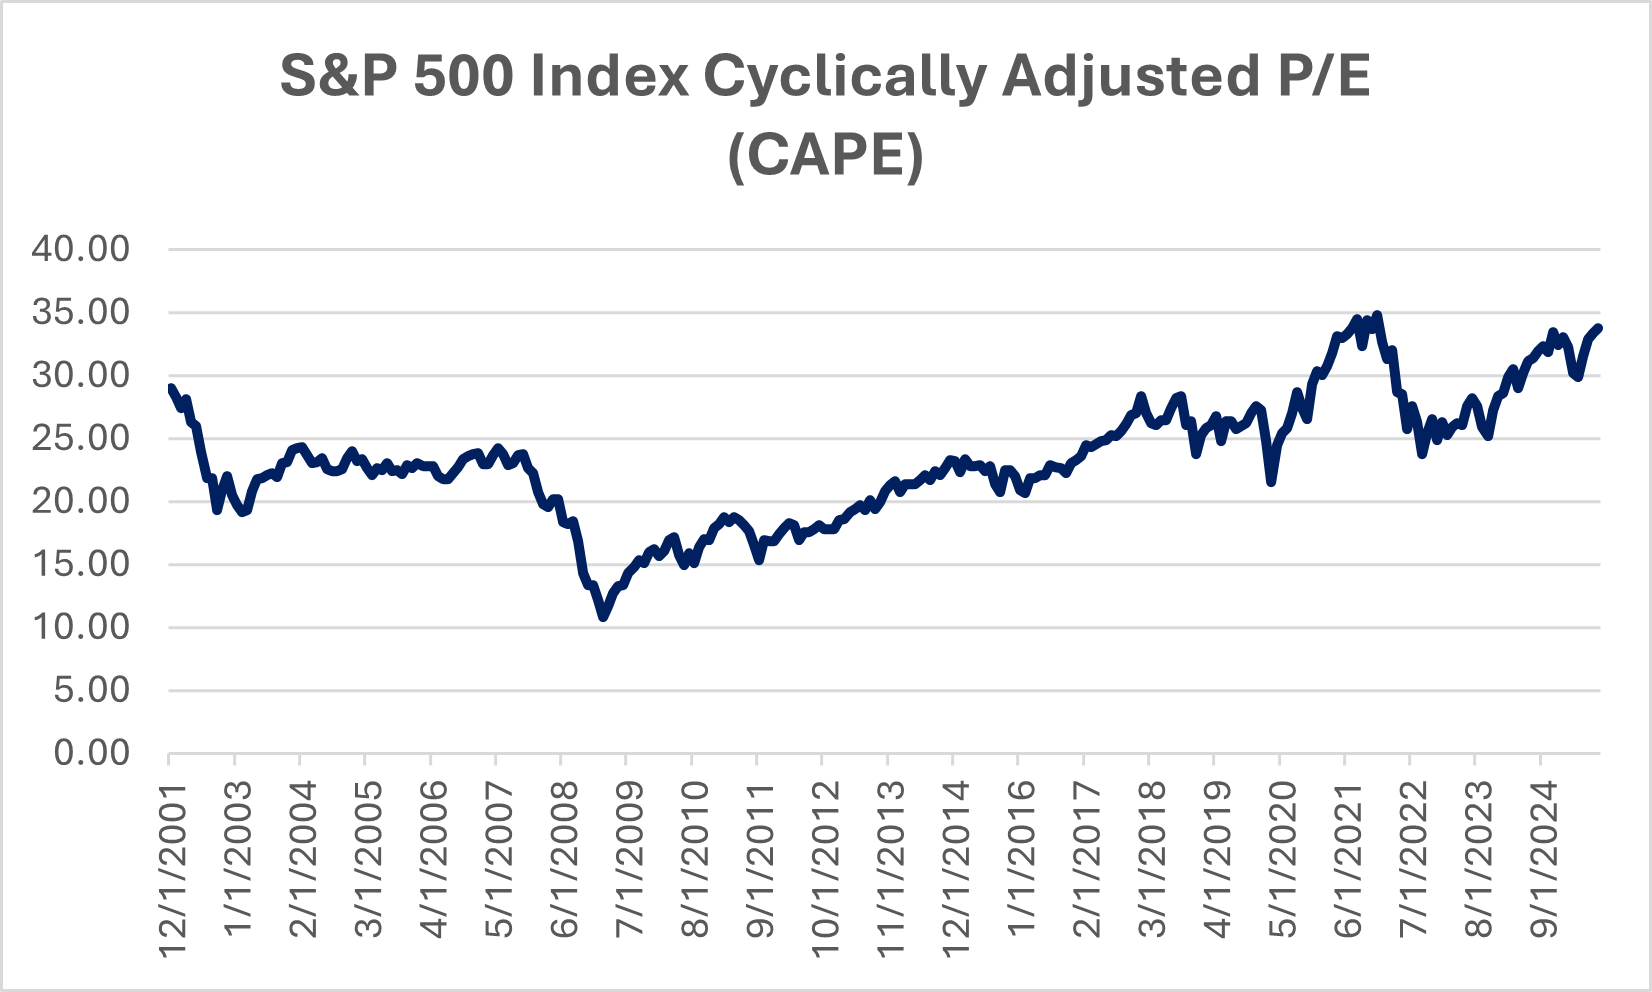
Not every 30 year period is created equally, of course. And, how an individual invests can increase or reduce their comfort in retirement. What is a good comparable time period for investors and prospective retirees today? Helpfully, where we started nearly a quarter century ago strongly resembles today’s markets. The S&P 500’s CAPE valuation is nearly identical.

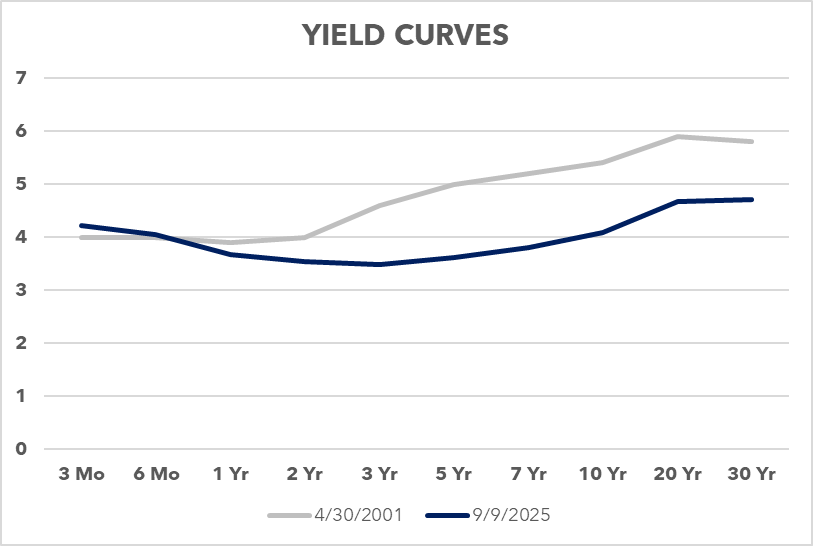
The front end of the yield curve is nearly identical and the back end only slightly different.

Even the excitement over a new technology is the same. Only then it was the commercialization of the internet. Today, of course, it is AI.

Running the 4% withdrawal rule through the specific time period from 2001 through August of 2025, utilizing different investment strategies, was elucidating.

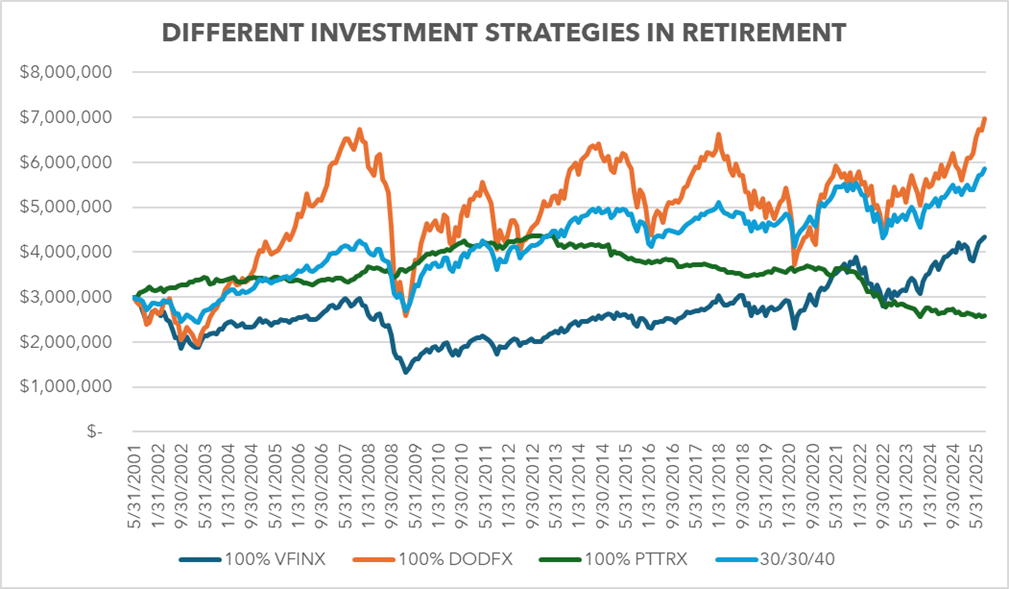
Each investor in our study retires on April 30, 2001 with a $3,000,000 portfolio. For simplicity, we assume the money is invested in tax-deferred accounts so that we can ignore them. One investor invests 100% in the S&P 500 (VFINX). Another invested 100% in international developed stocks (DODFX). A third, the most conversative, invested in 100% bonds (PTTRX). Finally, our balanced investors, placed their money 30% in the S&P 500, 30% in international stocks, and 40% in bonds. How did they all do?


One of the first things that jumps out from the graph is how off to the races the international stocks investor began. Investors today are quite used to the S&P 500 crushing the rest of the world’s stock market.


But, from 2022 to 2007 international developed stocks crushed the S&P 500. For those six calendar years, the S&P 500 grew 6% a year or 42% cumulatively. While, DODFX rose 19% a year or 187% cumulatively. One of the reasons for the international outperformance is that the US Dollar declined by 37% during that same time frame.


Additionally, you can see that our bond (PTTRX) investor was doing quite well from 2001 until 2013. Ideally, retirees could invest in safe bonds, exceed a 4% rate of return, and never have to worry about running out of money or returning to work. But, after the Great Financial Crisis, the Federal Reserve led by Chairman Ben Bernanke brought rates down to 0%, and left them there longer than anybody thought reasonable or possible, eventually significantly hurting our bond only investor.


The S&P 500 (VFINX) investor experience neatly illustrates the idea of “sequence risk.” Below, you can see the annualized returns. Notably, the S&P 500 has the highest return in the chart.

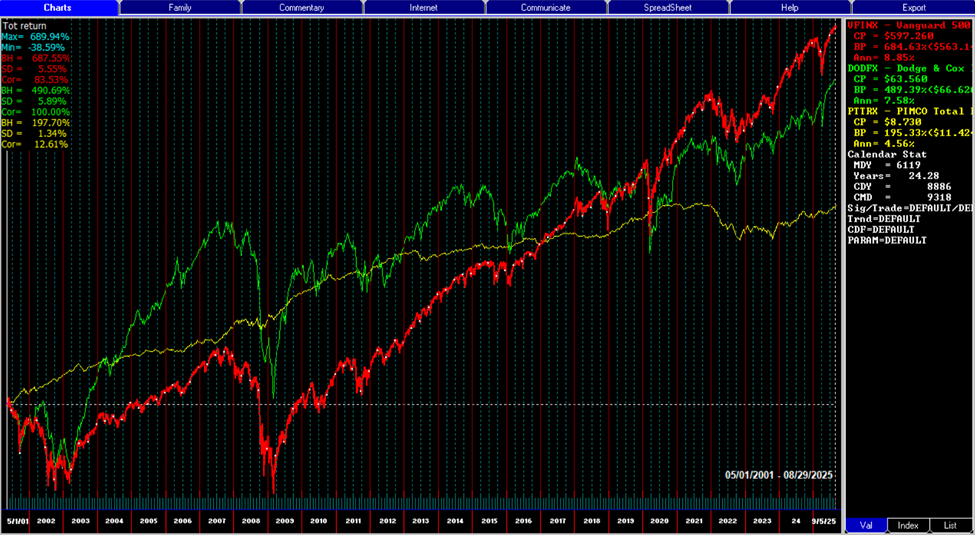
However, our S&P 500 investor above ended up with the same portfolio size as our bond investor. Despite earning materially higher returns. How? When your returns occur really matters. Remember, our retiree has to meet their expenses regardless of what the market does. Taking fixed withdrawals from a decimated portfolio in 2001 and 2008 meant the investor required amazing returns just to get back to even. While the S&P 500 earned the highest return over the full 25 years, this investor only finished in third place where it counted, in terms of portfolio size. This is important to ponder as the S&P 500’s valuation today is the same as it was in 2001 and 2007. Will the market crash like then? Who knows, we’re not forecasting an imminent one. However, while valuations are extreme, the risk remains elevated that one may occur.

Finally, our diversified investor finished in a very respectable position. While never dipping far below par, our diversified investor finished with about double the portfolio they started with. And that’s with riding through the storms of 2001, 2008, and Covid. Not bad.


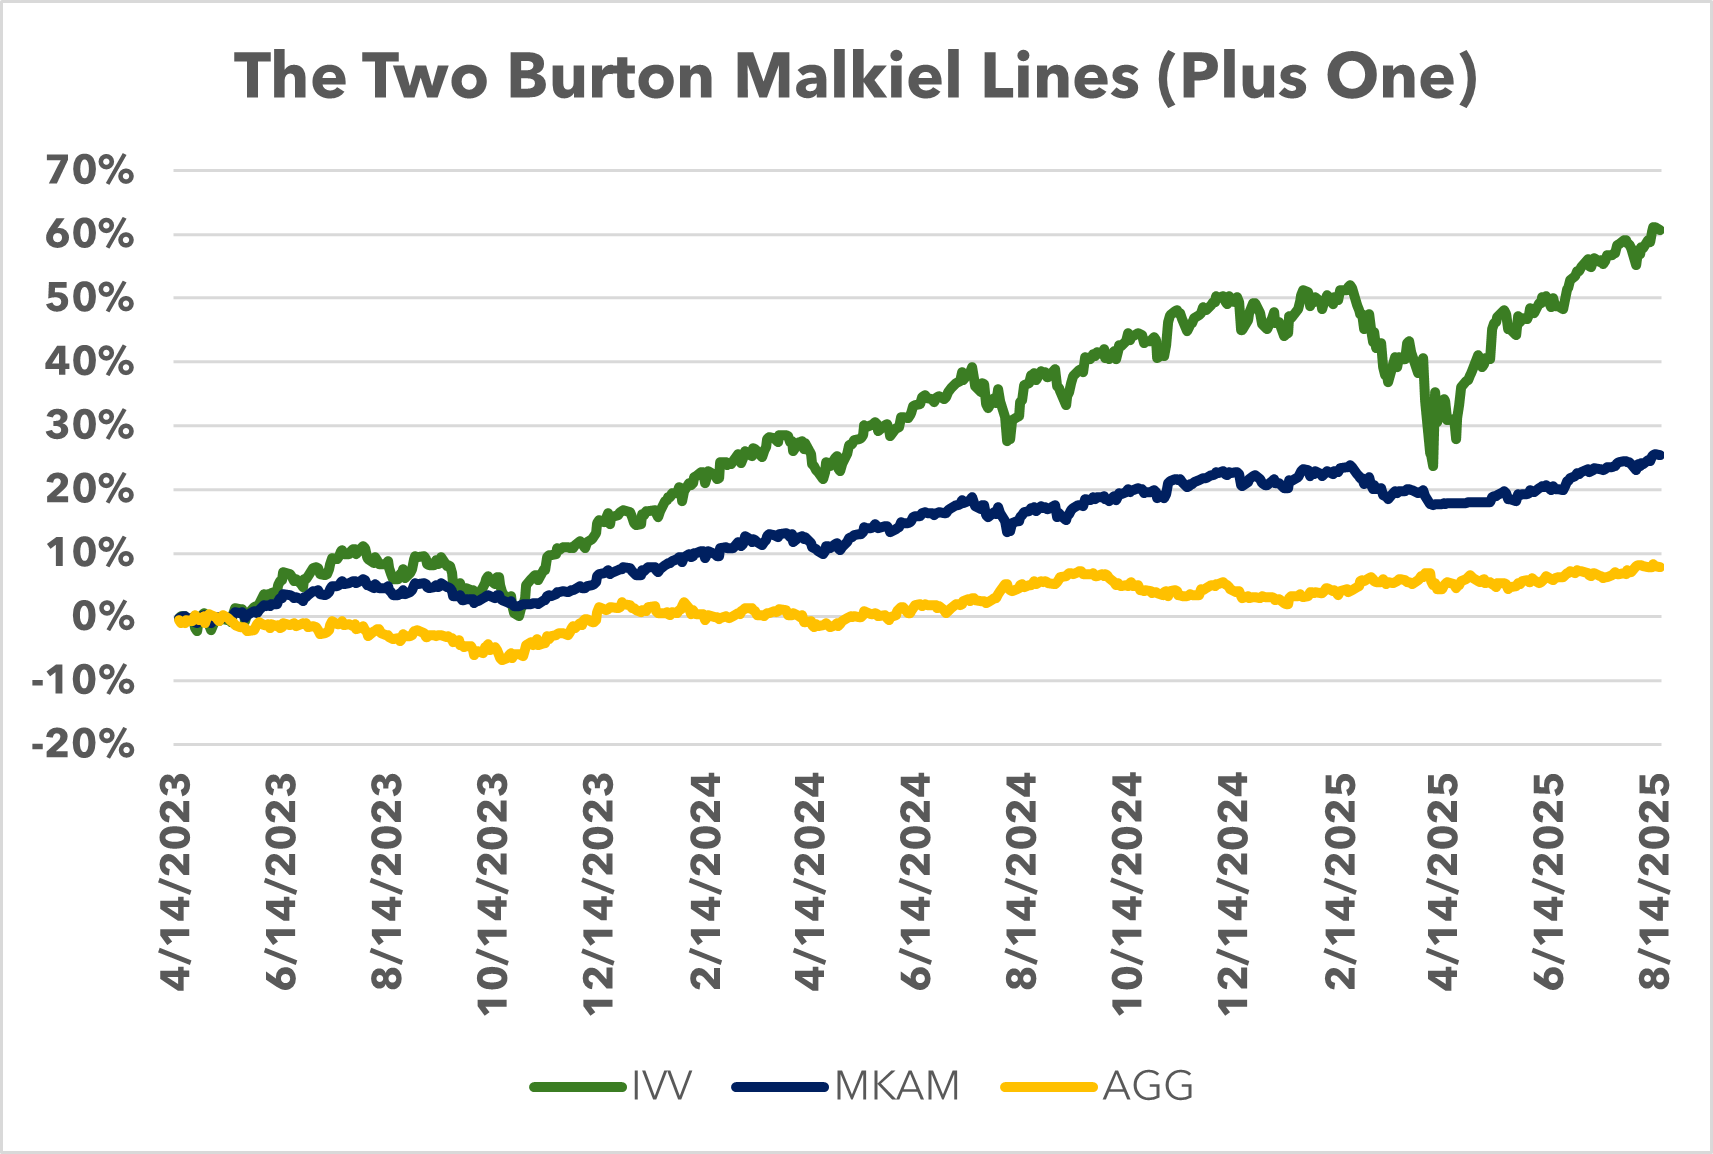
Of course, if we took the period from 2012, stripping out the DotCom crash and the Great Financial Crisis, the S&P 500 only investor completely dominated:

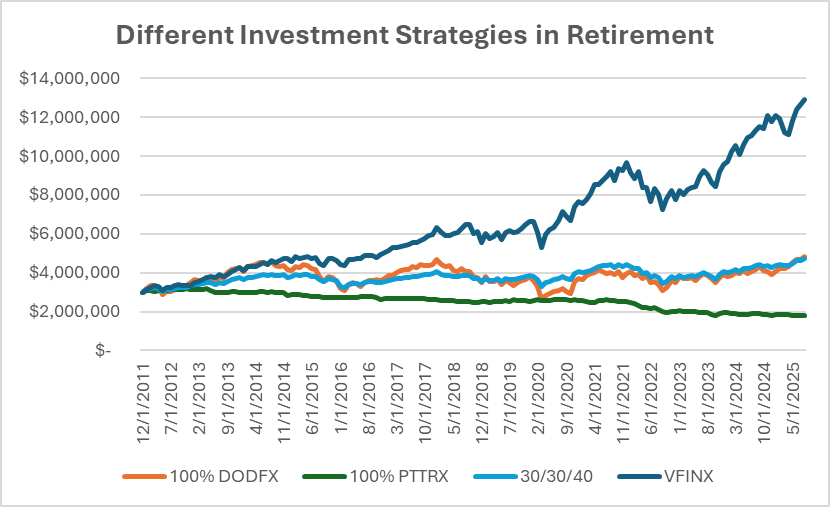
Implicitly, many investors today are primed to believe this experience is representative of the future. Afterall, who wouldn’t want to see their portfolio grow from $3-million to $13-million while making regular and substantial withdrawals. That's a very pleasant and reinforcing experience. However, the 2011 to 2025 results are very unlikely to repeat.

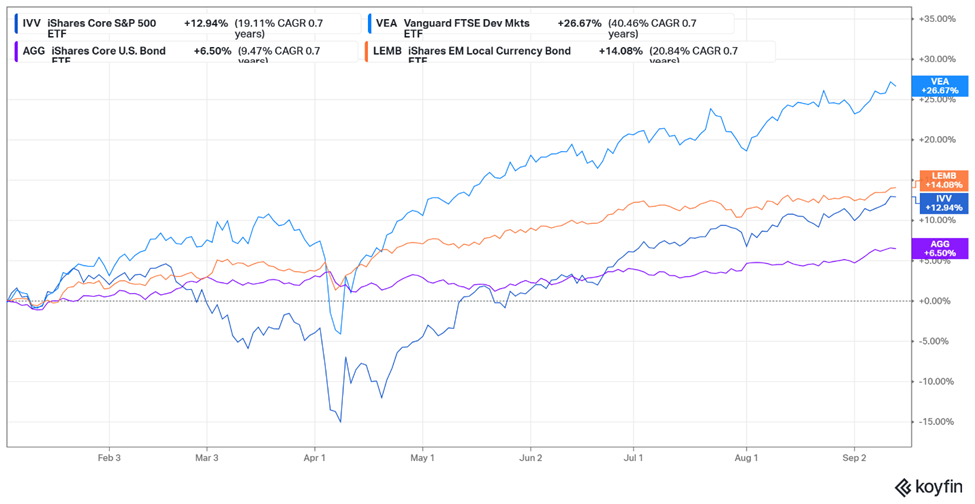
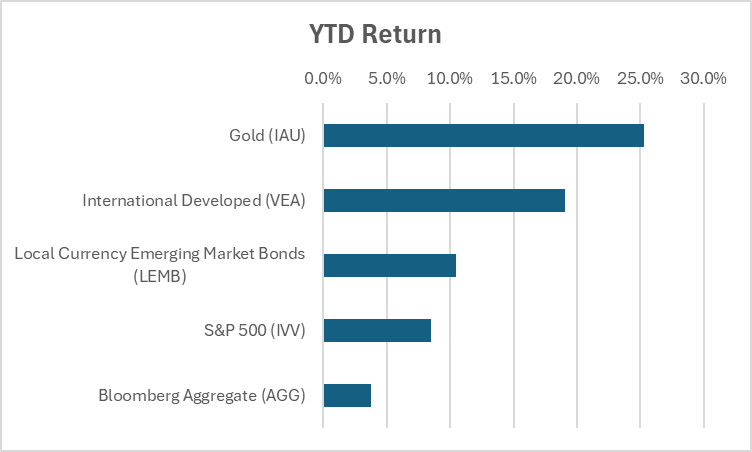
Is a period like the start of 2001 possible? Where investors in international stocks strongly outperform those exclusively featuring stocks in the USA. Here are year-to-date returns for 2025 through today’s close. After falling -15% the S&P 500 rallied back strongly to be up 12%. International stocks barely dipped below par and are now up 27% year-to-date. Déjà vu? Even local currency emerging market bonds are outperforming the S&P 500 with a lot less volatility and downside risk.

The 4% withdrawal rule remains timeless wisdom. How best to invest your hard earned portfolio evolves with the underlying market conditions, economics, and politics. Investors today would be wise to look at historical periods before 2011 to 2024 to gleam the right lessons.

Burton Malkiel Is Right – But He Didn’t Tell the Whole Story

Burton Malkiel Is Right – But He Didn’t Tell the Whole Story

Professor Burton Malkiel recently wrote an excellent op-ed in the New York Times that contained good analysis and sound, if incomplete, advice.
First, he established that the stock market was worryingly expensive. He wrote: “Stock markets regularly go to irrational extremes, and their volatility has caused economic hardship and financial pain. Now, jubilant investors are pushing our market to historic highs.” Consider the “Warren Buffett Indicator,” which compares the USA’s total stock market capitalization to GDP, shown below, which recently reached an all-time high:

Next, Mr. Malkiel compares today’s stock market multiples to the previous Dotcom and housing bubbles. He then understandably asks: “if history is repeating itself, what can we do to protect our financial futures?” He answers:


• “If you are retired, and need money soon, you should invest it in safe short-term bonds.”
• “For young investors just starting to build a retirement fund, a portfolio heavily weighted with stocks is appropriate.”


While this advice is broadly correct and helpful, it also leaves a lot of room for improvement. What about the people that are nearing retirement, but not quite there? Or the younger savers who just started to have a large enough portfolio to worry about? What do these people in the in between stages do. Also, for the retirees, is all-in bonds really the best they can do?

Since April of 2023, investors who shunned the stock market due to concerns about valuations, tariffs, or other valid concerns would have earned 3.2% annualized returns in the Bloomberg Aggregate bond index. Their standard deviation would have been 6% and their largest drawdown was -6.7%.

Alternatively, that same investor could have invested in the S&P 500 using a discipline of trend following and valuation, shown as “MKAM” below and returned 10% per year with a bond-like 6.2% standard deviation and a lower than bonds largest drawdown of only -3.7%.

Historically, investors only had the option of investing in the two choices Professor Malkiel laid out. For compliance reasons, I cannot tell you how to access the blue line in a very liquid, low cost way. However, astute readers can connect the dots quite easily. Perhaps you can ask ChatGPT for guidance. We tested it out and agreed with their first suggestion.


Burton Malkiel is right to note that today’s stock market is “getting scary.” However, using a discipline of trend following and valuation can remove the fear while, we believe, generating better than bond returns.

Better Than 60/40

Better Than 60/40

The latest Vanguard Capital Markets Model Forecast has an expected return for the S&P 500 over the next decade of 4%. They also forecast an Aggregate bond return of 4.5%. It may seem preposterous that the bond expected return would be higher than the S&P 500. But, this was precisely the case in 1999. And it came to fruition: bonds beat stocks from 1999 through 2017. The late 1990’s was nothing like today, however. The pre Y2K era was characterized by investor euphoria over a new technology that was going to transform the world. Investors were willing to pay any price for any company having to do with AI, I mean the internet. Again, nothing like today.

So, forecasting the classic 60/40 investment approach - 60% S&P 500, 40% Bloomberg Aggregate Bond Index- that so many advisors consciously or unconsciously use, an investor can pencil in returns of: 4.2% per year for the next 10 years. In other words, not great. 10-Year US Treasuries offer 4.2% today. An investor with a 10-year horizon could buy a T-bond, ignore the markets, experience no risk to their outcome and match an uncertain and volatile 60/40 portfolio.

Or, investors can start to deviate from the 60/40 benchmark. One change that should prove accretive, after about 15 years of detracting value, is swapping some of the S&P 500 into international stocks. Vanguard’s same model forecasts 6.7% for international stocks. Two things about international stocks are true:

  1. International companies, generally, are less dynamic and grow slower than their US peers
  2. International stocks are priced at or below average, while US stocks are near peak over-valuation

The discount for international stocks is well above what is warranted by the (not as big as you may think) gap in growth they historically experience relative to their American peers. The graph below compares stock markets around the world by dividing their current CAPE, courtesy of Siblis Research, relative to their averages since 1980 (or shorter, if data not available). A market priced at 1 is exactly in line with their average; for example, Holland and Poland. Markets below 1 trade for a discount; such as, Sweden, France, Switzerland, etc. Growth stocks in the USA trade for the highest premium at 1.8.

Source: Siblis Research and MKAM

One final note about the compelling opportunity in international stocks. Models like Vanguard tend to assume away changes in exchange rates. They are hard to forecast and over the very long run, currencies tend to rise and fall and cancel out. However, currencies often move in prolonged trends. The US Dollar rose from 2011 through 2024. In 2025 it has been falling. If the US Dollar continues to weaken, and there is a very good argument to be made that it will, the actual investor return for Americans investing abroad should prove higher than Vanguard’s expected returns.

Introducing Beyond 60/40

Introducing Beyond 60/40

Year-to-date through July, a traditional 60/40 portfolio, 60% in the S&P 500, and 40% in the Bloomberg Aggregate, would have returned 6.6%. Completely respectable for 7 months of the year.

However, returns could have been improved to 11.2% if half of the 60% was carved out from the S&P 500 and allocated to international developed stocks; another 5% to local currency emerging market bonds; and 5% to gold.

Since the S&P 500 bottomed at 666 in 2009, owning the S&P 500 was all investors needed. Foreign investors received even better returns for owning American stocks as the US Dollar relentlessly appreciated as well. But, at the start of 2025 it was our contention that the tides were changing. We believe 2025 is not a temporary aberration but augurs a different decade to come. We will detail it as it unfolds here.

Great! You’ve successfully signed up.

Welcome back! You've successfully signed in.

You've successfully subscribed to Beyond 60/40.

Success! Check your email for magic link to sign-in.

Success! Your billing info has been updated.

Your billing was not updated.